Wednesday, December 11, 2019
The Final Project, GIS 5043 Lab
Below is the final result of the semester work on ArcGIS. This link contains a storymap of a proposed idea of study on a transmission line effects on surrounding areas of Manatee and Sarasota county. Additionally, this project was achieved from the combination of the previous techniques learn throughout the semester. This link is https://storymaps.arcgis.com/stories/4199e38686b14213b6e3968b5ad43aef; and it will lead you to the story map titled "Impositions for the Installation of the Transmission Line."
Thursday, November 7, 2019
Georeferencing and 3D Model
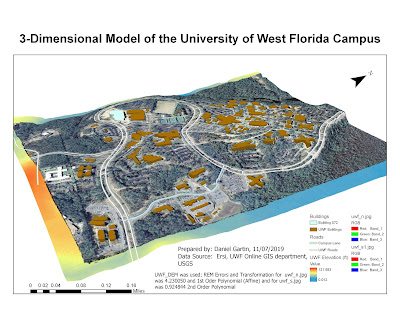
This lab works was with georeferencing and 3D model of the UWF campus imagery. The lime green and brown colors represent the UWF buildings, whereas the Mapped Building 072. Pale white is the general road of the UWF campus, while blue is the Campus Lane road we mapped. To create the 3D image of UWF campus, UWF_Lidar.lasd was used. The red dot represents the Eagle nest near UWF campus.
 |
| Figure 1: 3-D Model of the UWF Main Campus |
Tuesday, October 22, 2019
Geocoding
This week on GIS (5043), the lab focus on data between excel and ArcGIS. Specifically the lab required taking school data of Brevard County, Florida, adding and organizing it to excel, then apply it to ArcGIS. Additionally, the lab focused on locating and matching schools to appropriate location using street addresses and physical matching for schools that did not automatically match. The finish product can be viewed on ArcGIS online at the http://arcg.is/0KG0Oz website.
Thursday, October 3, 2019
Vector Analysis
Sunday, September 15, 2019
Week 3: Public Safety and Projections
Saturday, September 7, 2019
Week 2: Cartography
 | |
|
Thursday, August 29, 2019
Week 1: ArcGIS Overview
Subscribe to:
Comments (Atom)
The Final Project, GIS 5043 Lab
Below is the final result of the semester work on ArcGIS. This link contains a storymap of a proposed idea of study on a transmission line ...
-
Today began the introduction work for ArcGIS coursework. The map above is the result of learning the overview material
-
This lab works was with georeferencing and 3D model of the UWF campus imagery. The lime green and brown colors represent the UWF buildings, ...
-
This week on GIS (5043), the lab focus on data between excel and ArcGIS. Specifically the lab required taking school data of Brevard County...


